Team MC^2 : ARC2017 RGB-D Dataset
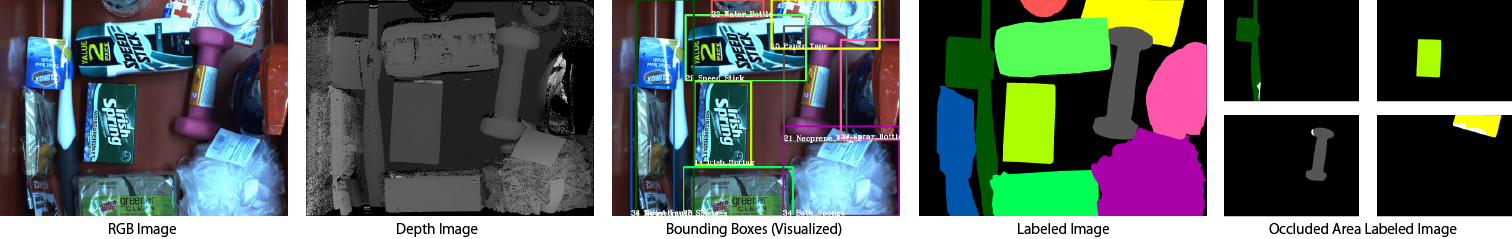
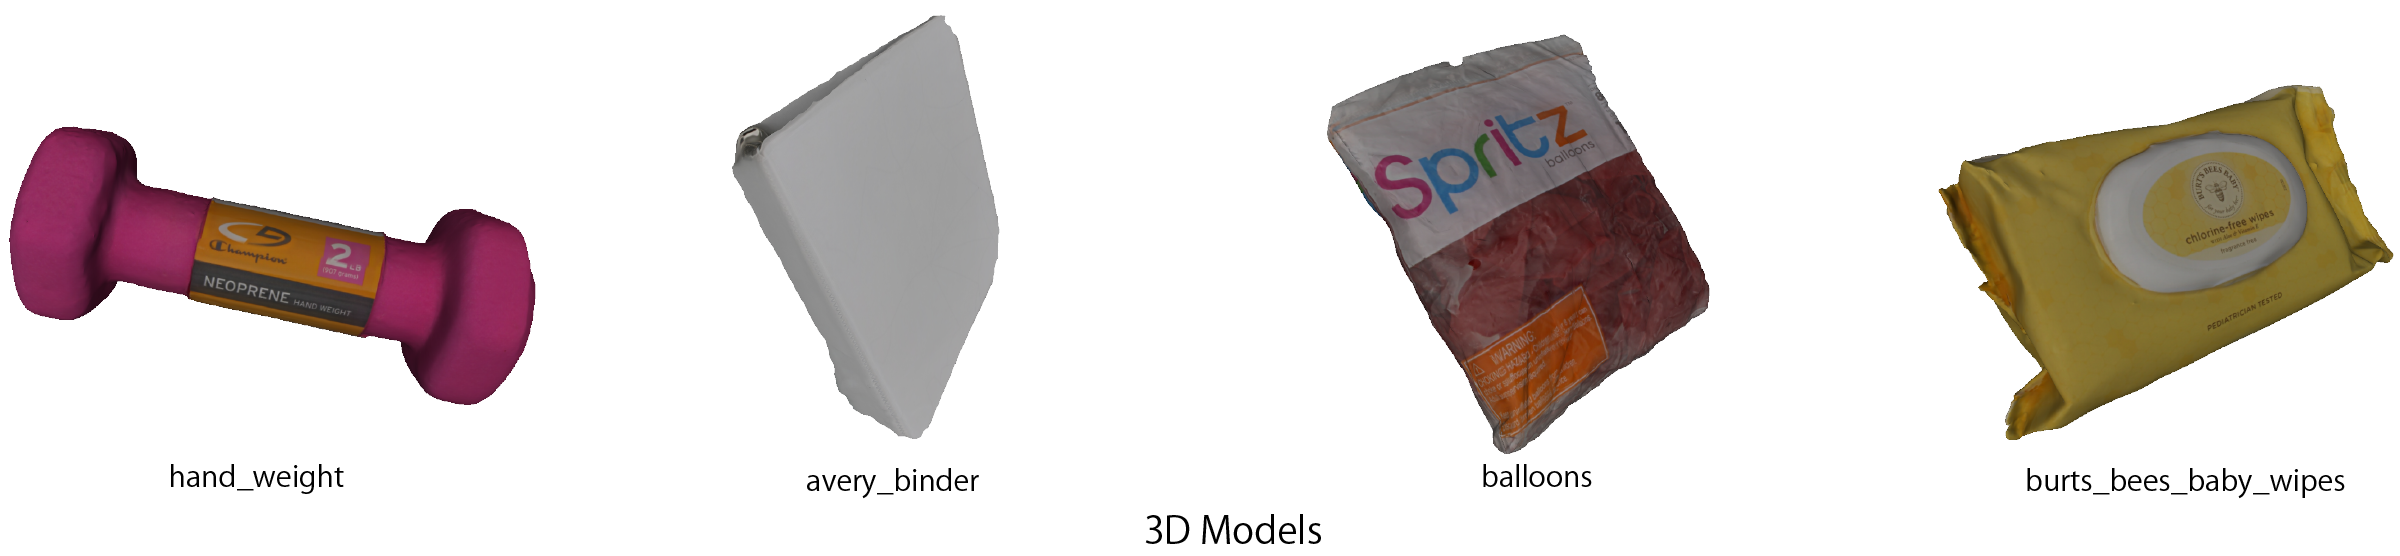
The Amazon Robotics Challenge (ARC) is a competition for automation of product distribution posed as a problem in which a robot must recognize and pick a specified item among items displayed on a storage shelf or in a tote. The dataset used by Team MC^2 for the ARC2017 is published on this page. The dataset consists of two types of data: RGB images and depth images acquired by Mitsubishi MELFA-3D Vision. For quantitative evaluation, a ground truth image labeled with a specified color, Occluded area image which overlapped area labeled with the different color, and a text file including bounding box annotation are provided for each item. 3D models created by the Ortery Technologies, Inc. 3D MFP for each item are also available for the data augmentation.
Overview of Dataset
We created dataset with the 40 types of items which used in the ARC2017. These have various shapes and other attributes, including items packaged in boxes and vinyl, deformable items, etc.
We prepared the data assuming the following five tasks.
Task 1: Object detection for known class items
Task 2: Segmentation for known class items
Task 3: Occluded area segmentation for known class items
Task 4: Object detection for unknown class items
Task 5: Segmentation for unknown class items
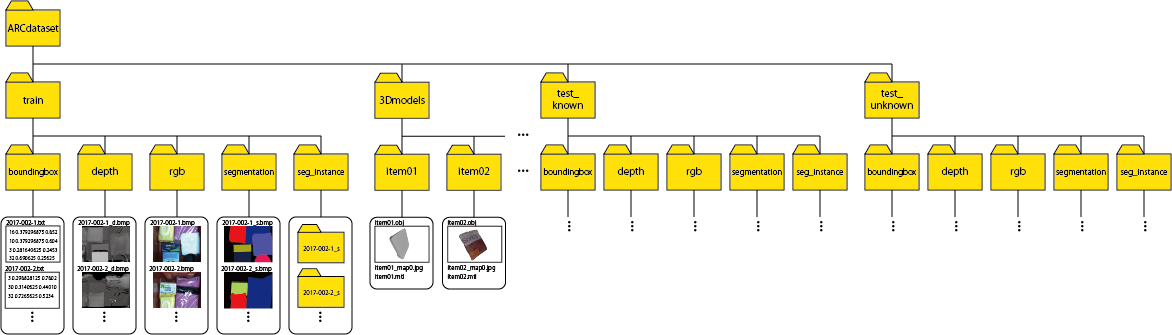
Dataset structure
The dataset was created assuming that there are multiple items in the tote or one item in the tote.
The dataset is divided into training data (train), test data (test_known), and test data for the unknown class items (test_unknown) assuming learning and reasoning of machine learning or deep learning.
* train: images with the same scene as the test data (440 scenes × 2 shots = 880 images) and images with only 1 item (10 shots for each item = 410 images)
* test_known: images with as many items in the tote as possible were shot twice (110 scenes × 2 shots = 220 images)
* test_unknown: images with as many APC2015 items in the tote as possible were shot twice (100 scenes × 2 shots = 200 images) APC2016/ARC2017 items are excluded
Folder structure of three types of scenes is shown below.
The folder is divided into test_known data, test_unknown and training(train) data. Furthermore, the test data and training data are divided into bounding box data, RGB images, depth images, labeling data, and occluded area labeling data.
For 3D model data, folders are divided for each item.
Data formats
The data formats are listed below.
RGB image
* File name “[test|train]/rgb/2017-XXX-XX.bmp”
* Size “1280×960 pixels”
Depth image
* File name “[test|train]/depth/2017-XXX-XX_d.bmp”
* Size “1280×960 pixels”
* Represents distance as values between 0 and 255 in a grayscale image
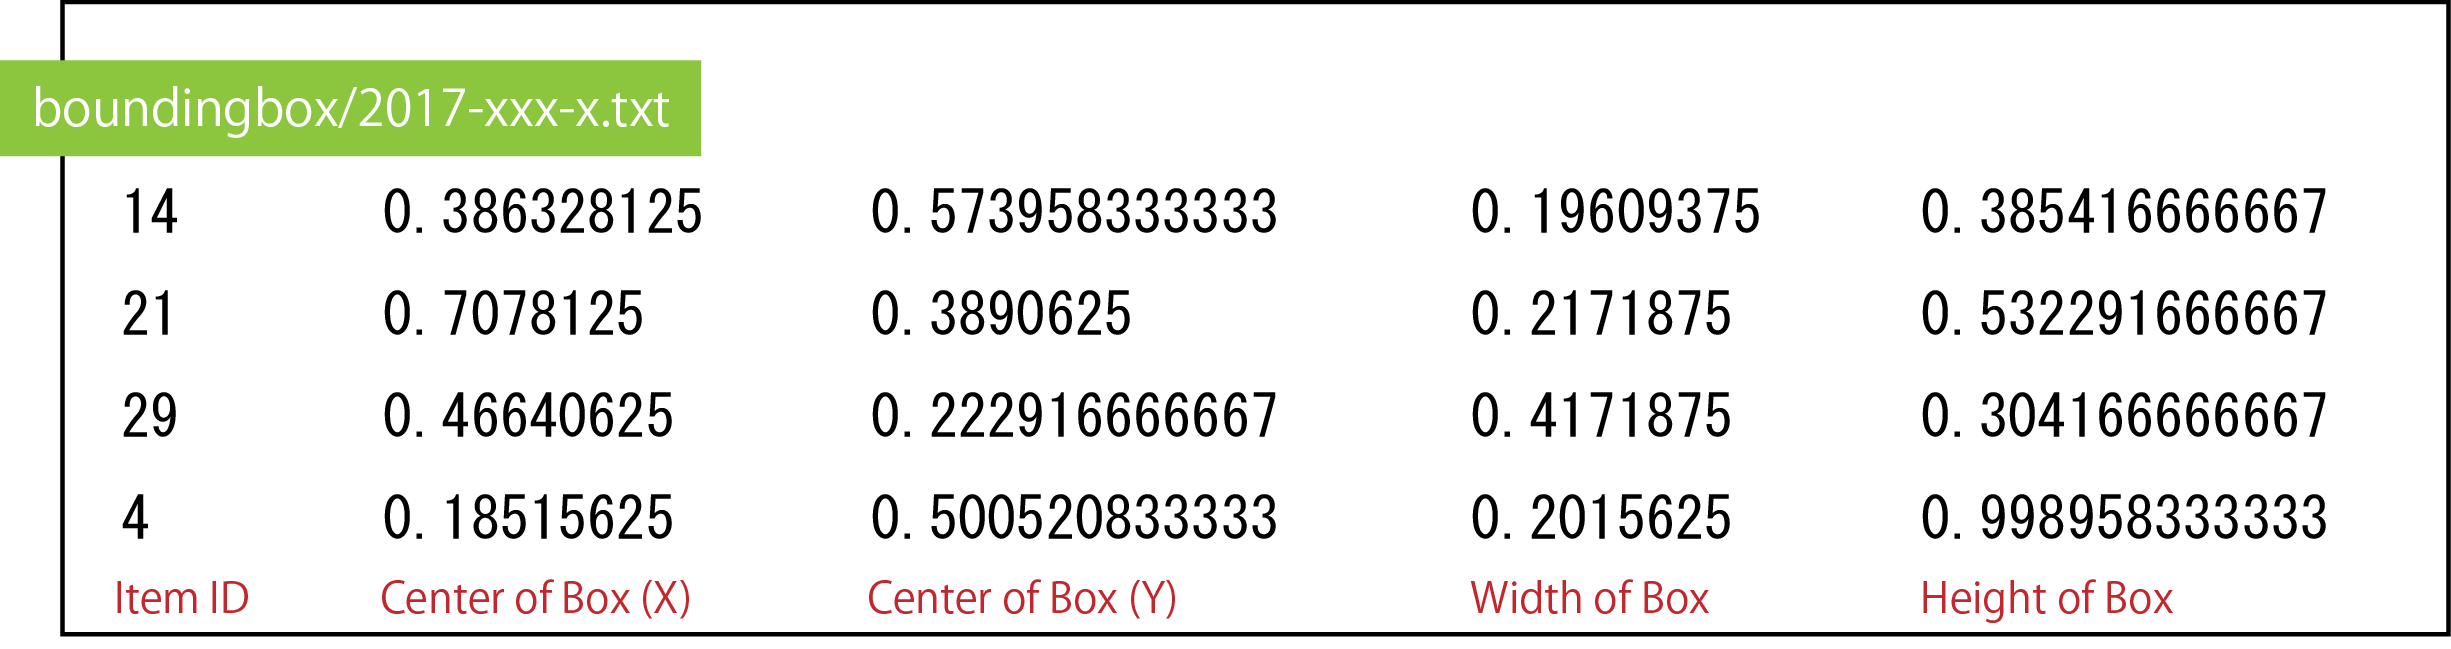
Bounding boxes data
* File name “[test|train]/boundingbox/2017-XXX-XX.txt”
* The item ID and the coordinates of the bounding box are written in the text file.
* The coordinates are described in the order of “[Box center X], [Box center Y], [Box width], [Box height]”. The bounding box data are also normalized from 0 to 1.
Label image (semantic segmentation ground truth)
* File name “[test|train]/segmentation/2017-XXX-XX_s.bmp”
* Size “1280×960 pixles”
A label image is created for each RGB image. For each item, a region corresponding to the item region is distinguished from the other regions by painting it with a specified color. The background region is painted black.
A number corresponding to each item of the labeling data is stored in the “ItemList.pdf” file, and the color code for each item is stored in the “SegmentationTeach” file. The color code is displayed in the table below, too.
| Item ID | R | G | B | Color | Item Image |
| BG | 0 | 0 | 0 |  |
|
| Item 1 | 85 | 0 | 0 |  |
|
| Item 2 | 170 | 0 | 0 |  |
|
| Item 3 | 255 | 0 | 0 |  |
|
| Item 4 | 0 | 85 | 0 |  |
|
| Item 5 | 85 | 85 | 0 |  |
|
| Item 6 | 170 | 85 | 0 |  |
|
| Item 7 | 255 | 85 | 0 |  |
|
| Item 8 | 0 | 170 | 0 |  |
|
| Item 9 | 85 | 170 | 0 | 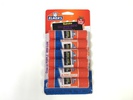 |
| Item ID | R | G | B | Color | Item Image |
| Item 10 | 170 | 170 | 0 |  |
|
| Item 11 | 255 | 170 | 0 |  |
|
| Item 12 | 0 | 255 | 0 | 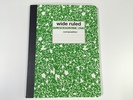 |
|
| Item 13 | 85 | 255 | 0 | 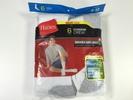 |
|
| Item 14 | 170 | 255 | 0 |  |
|
| Item 15 | 255 | 255 | 0 |  |
|
| Item 16 | 0 | 0 | 85 | 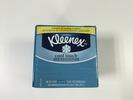 |
|
| Item 17 | 85 | 0 | 85 |  |
|
| Item 18 | 170 | 0 | 85 |  |
|
| Item 19 | 255 | 0 | 85 |  |
| Item ID | R | G | B | Color | Item Image |
| Item 20 | 0 | 85 | 85 |  |
|
| Item 21 | 85 | 85 | 85 |  |
|
| Item 22 | 170 | 85 | 85 |  |
|
| Item 23 | 255 | 85 | 85 |  |
|
| Item 24 | 0 | 170 | 85 |  |
|
| Item 25 | 85 | 170 | 85 |  |
|
| Item 26 | 170 | 170 | 85 |  |
|
| Item 27 | 255 | 170 | 85 |  |
|
| Item 28 | 0 | 255 | 85 |  |
|
| Item 29 | 85 | 255 | 85 |  |
| Item ID | R | G | B | Color | Item Image |
| Item 30 | 170 | 255 | 85 |  |
|
| Item 31 | 255 | 255 | 85 |  |
|
| Item 32 | 0 | 0 | 170 |  |
|
| Item 33 | 85 | 0 | 170 |  |
|
| Item 34 | 170 | 0 | 170 |  |
|
| Item 35 | 255 | 0 | 170 |  |
|
| Item 36 | 0 | 85 | 170 | 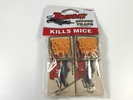 |
|
| Item 37 | 85 | 85 | 170 | 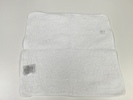 |
|
| Item 38 | 170 | 85 | 170 | 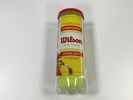 |
|
| Item 39 | 255 | 85 | 170 |  |
|
| Item 40 | 0 | 170 | 170 | 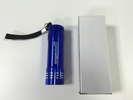 |
Occluded area labeled image
* File name “[train|test_known]/seg_instance/2017-XXX-XX_s/2017-XXX-XX_s_XX.bmp”
* Size “1280×960”
* It has one image for each item label. The occluded area is labeled in white (255, 255, 255).
3D Models
* File name “3Dmodels/itemXX/itemXX.obj”
* Browsable by 3D Builder(Win10), MeshLab, Xcode(macOS), Blender, etc.
* Material data “itemXX.mtl” and texture data “itemXX_mapX.jpg” are attached.
The material data and texture data should be placed in the same directory as the obj file.
Evaluation method
For robot picking, estimation of the 6D pose of the item is ideal. However, this dataset includes non-rigid-body items and other items for which 6D pose estimation can be difficult.
We therefore used two kinds of evaluation methods: evaluation by overlap ratio (intersection over union (IoU)) of bounding box and evaluation by segmentation region.
- Evaluation of bounding box by IoU
In the evaluation of the bounding box by IoU, we evaluate by comparing the overlap rate of the detected bounding box with that of the bounding box of the ground truth.
For each detected bounding box, we compare it with the bounding boxes of all ground truth existing in the image with the IoU.
The ground truth bounding box that has the highest IoU is assumed to be the estimated bounding box.
When the class of this box and the class of the detected box are the same, the detection is successful, and if they are different, the detection has failed. - Evaluation by segmentation regionEvaluation by segmentation region
In evaluation by segmentation region, evaluation is performed by comparing the depth image segmentation results and the labeling data. For the segmentation evaluation, the segmentation results and the labeling data are compared in one-pixel units, and the detection rate and precision are calculated for all of the pixels in one image. From the calculated values, an F value is obtained. The segmentation is evaluated as successful if the F value is equal to or higher than a threshold (default: 0.5); otherwise, it is evaluated as failed.
Download
2018/07/12 The dataset has been expanded. Along with this, we redesigned the file structure and so on.
2018/07/18 We have changed the data set because there was have a problem with the added data.
2018/07/20 We renewed the evaluation code and published it on GitHub. Also, we have released sample code of SegNet, SSD, and Multitask DSSD.
All images are in bmp format, but because of their large size, we also prepared images converted to png format.
* Full Dataset: Team MC^2 : ARC2017 RGB-D Dataset (tar.gz, 4.72GiB)
* Full Dataset(png): Team MC^2 : ARC2017 RGB-D Dataset (png) (zip, 3.40GiB)
* Item list: ItemList.pdf (262KiB)
* Segmentation color code list: SegmentationTeach.pdf (310KiB) / SegmentationTeach.xlsx (331KiB)
* Evaluation code(Bounding Box/Segmentation): MC2ARCdataset_evaluate (GitHub)
・Sample code of SegNet(ChainerCV): segnet_arc (GitHub)
・Sample code of SSD/Multitask DSSD(Chainer): MT-DSSD (GitHub)
How to use evaluation code
The code is different for each evaluation method.
This evaluation code requires the libraries listed below.
* Python 3.x / 2.x (recommended version >= 3.5.1 or >= 2.7.11)
* OpenCV 3.x / 2.x
* numpy (recommended version >= 1.10)
* matplotlib (recommended version >= 1.4)
Evaluation of bounding box by IoU
Preparetion of data
The evaluation code(“MC2ARCdataset_evaluate/detect_evaluation/”) requires the data listed below.
・Put the test image in ./images/
・Put the detection results file (txt) in ./results/
・Put the ground truth data file (txt) in ./teach/
The test image and the ground truth of the bounding box can use the data in the “test” folder of the dataset.
The detection result should be in a format where each value is separated with a space. The evaluation code supports the following three formats.
The coordinates, width, and height must be normalized with 0 to 1 (divide by image size).
Settings of program
Please change program(“detect_evaluation.py”) as below.
IMAGE_EXT = “png” : Extension of test image( png, bmp )
WAITTIME = 0 : Number of milliseconds in OpenCV’s WaitKey() function
If you set this value to about 100, you can check the evaluation flow. If you set this to 0, the program does not check the evaluation flow and evaluates immediately.
LABEL_FLAG = 0 : Set to 1 if the detection result has a class name.
NORMALIZED = 1 : Set to 0 if the detection result is not normalized.
THRESH = 0.55 : Threshold of IoU for a detection to be judged as successful
How to run
Please run “MC2ARCdataset_evaluate/detect_evaluation/detect_evaluation.py”; this program calculates the IoU of the detection results with all the the ground truth boxes included in this image. The ground truth box with the highest IoU is assumed to correspond to the box whose detection results we are trying to estimate. For the found box class and detected box, calculate the IoU of the two boxes. This calculates the results, prediction class, and ground truth class. Write it to a text file.
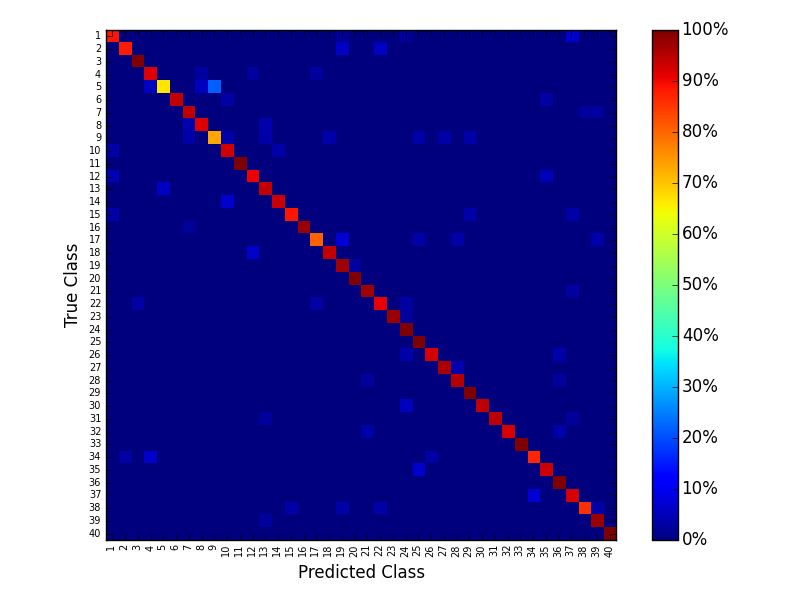
Next, the program calculates the confusion matrix using the text files obtained by the above process. A successful detection is deemed to be when the IoU of the teacher signal and detection result exceeds a threshold value and the detected class is correct. When the calculation has finished, the program outputs the confusion matrix in the form of an image and the following 3 values.
* Recognition rate: the recognition rate excluding missed detections
* Miss rate: the rate of missed detections
* Mean IoU: average of all IoU values including false detections
* If you will run this program again, please delete the whole folder of “./results/matchingResults/”.
Evaluation of segmentation
First, prepare the teacher image and the segmentation result image in different directories. At this time, it is necessary to make the same image size and extension (png).
Next, Please change program(“segment_evaluation.py”) as below.
gt_path = “./label/” : Path of the directory that was contained correct label images.
result_path = “./results/” : Path of the directory that was contained result images.
Finally, run “segment_evaluation.py” and evaluation. Please note that it takes time to evaluate every pixel.
Evaluation of Team MC^2 recognition method
We used the code described above to evaluate the detection results of our method.
Evaluation Method
Single-Shot Multibox Detector(SSD): Detect object candidate regions and performs class estimation with a single network. It uses a “default box” to detect object candidate regions. The default box is applied to feature maps with multiple resolutions.
We propose a model that improves on SSD. This improved SSD uses estimations of “objectness” to facilitate the detection of item (i.e., classification into objects and non-objects) that are not included in the learning data (unknown class object). The architecture of SSD incorporating objectness estimations is quite simple and close to that of the original SSD. In addition to the object candidate region estimator and item classifier, we added an objectness discriminator. The objectness discriminator is exactly the same as the item classifier, and classifies images into two classes: object-like, and not object-like. Of these, the likelihood of something being classed as “object-like” is called its objectness, and if this exceeds a threshold value then it is judged to be an object. For a box that is judged to be object-like, the likelihood of it containing an item is checked, and the class with a high likelihood is output as the final detection result. At this time, if the likelihood of each class is extremely low, or if the likelihood of the background class is high, the item is deemed to be an unknown object.
Evaluation Result
Recognition rate: 0.890423572744
Miss rate: 0.256164383562
Mean IoU:0.792050506884
Confusion Matrix
*We would like to continue adding new evaluation results, so we welcome all contributions of evaluation results for this Dataset.
Disclaimer
Although due care was taken in preparing this information on the published program and data, we make no guarantee concerning that information. The Machine Perception and Robotics Group, which created the program, the materials, and the Web site, accept no responsibility for any damage that may be caused by their use or by browsing this site. We also accept no responsibility for any damage that may arise from program revisions or redistribution. With agreement to these disclaimers, the published program may be used for research purposes only and under the responsibility of the user. For communication concerning commercial use, please contact the following person.
Contact
Hironobu Fujiyoshi:fujiyoshi@isc.chubu.ac.jp